
Australian students motivated to achieve – but some more motivated than others
Research 10 Sep 2018 7 minute readA new report finds that Australian 15-year-olds may be more motivated to achieve than the majority of their OECD peers, but motivation is significantly affected by disadvantage.
A new report from the Australian Council for Educational Research (ACER) on data from the 2015 OECD Programme for International Student Assessment (PISA) survey shows that Australian students are more motivated to achieve than peers in 26 of the 35 OECD countries surveyed. However, significant differences were found between cultural and geographical groupings within Australia and motivation levels were strongly affected by factors associated with disadvantage.
ACER Deputy CEO (Research) Dr Sue Thomson says the report shows that disadvantage continues to negatively affect Australian students.
“The data show that disadvantage associated with an Indigenous background, low socioeconomic status and living in a rural or remote area is related to lower motivation levels,’ Dr Thomson said. ‘This is important because motivation to achieve plays a key role in educational success, and in an individual’s drive to set and attain education and career goals.’
How do we measure motivation?
PISA measured motivation levels by collecting responses to five items on a scale (strongly agree, agree, disagree, strongly disagree):
- I want top grades in most or all of my courses
- I want to be able to select from among the best opportunities available when I graduate
- I want to be the best, whatever I do
- I see myself as an ambitious person
- I want to be one of the best students in my class.
An index of achievement motivation was created from students’ responses, scaled so that higher scores on the index reflected stronger agreement to the items.
Motivation by numbers
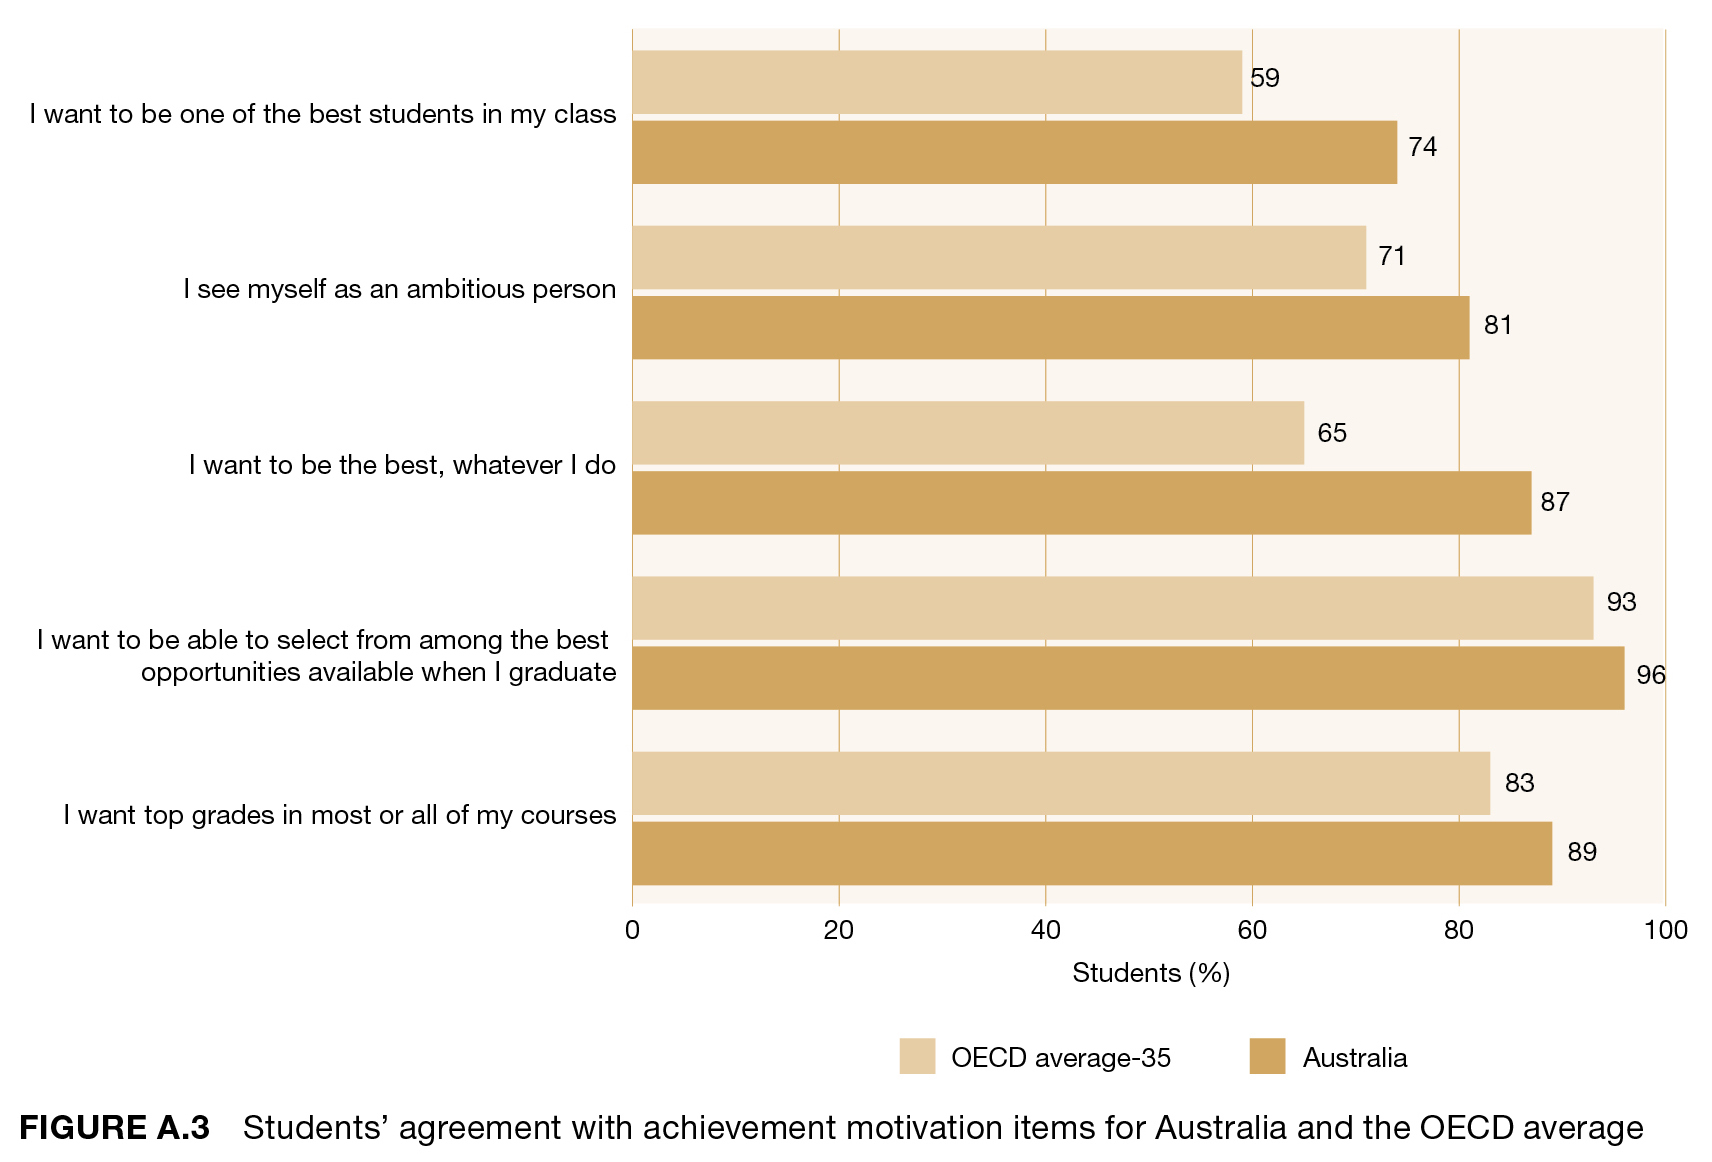
Higher proportions of Australian students agreed with all of the motivation items than the OECD average, with the largest difference recorded against I want to be the best, whatever I do – 87 per cent of Australian students agreed, compared with the OECD average of 65 per cent. Highest and lowest on that item were US students at 95 per cent and Finnish students at 36 per cent. Figure A.3 explains more.
Within Australia, students in NSW had the highest motivation to achieve while students in Tasmania recorded the lowest motivation levels. One of the biggest individual disparities was recorded against the statement, I want to be one of the best students in my class, with 79 per cent of students in NSW in agreement in contrast to 64 per cent of Tasmanian students. Greater proportions of students in all states and territories recorded higher agreement to all items than the OECD average.
Across the country, female, non-Indigenous, high socioeconomic status (SES) or metropolitan-based students were more highly motivated to achieve than their peers, while Australian-born students recorded the lowest motivation levels, as compared with first generation and foreign-born students.
More specifically, students from the highest SES quartile demonstrated significantly higher levels of agreement to ‘competitive’ achievement motivation items – 82 per cent agreed I want to be one of the best students in my class and 86 per cent agreed I see myself as an ambitious person compared to students in the lowest SES quartile (68 per cent and 76 per cent respectively). More non-Indigenous students than Indigenous students agreed that I see myself as an ambitious person (75 per cent and 66 per cent respectively). Another striking difference was noted between the proportions of Australian-born and foreign-born students who agreed that I want to be one of the best students in my class – 83 per cent of students born overseas agreed with this item compared to 71 per cent of students born in Australia (to Australian-born parents). Table A4 goes into more detail.
Table A.4 Australian students' agreement with achievement motivation items
| Demographic group | I want top grades in most or all of my courses | I want to be able to select from among the best opportunities available when I graduate | I want to be the best, whatever I do | I see myself as an ambitious person | I want to be one of the best students in my class | |||||
|---|---|---|---|---|---|---|---|---|---|---|
| % | SE | % | SE | % | SE | % | SE | % | SE | |
| Sex | ||||||||||
| Females | 91 | 0.4 | 97 | 0.3 | 86 | 0.6 | 81 | 0.6 | 75 | 0.7 |
| Males | 87 | 0.5 | 95 | 0.4 | 87 | 0.5 | 81 | 0.5 | 74 | 0.7 |
| Indigenous background | ||||||||||
| Indigenous | 86 | 1.0 | 93 | 0.7 | 85 | 0.8 | 76 | 1.0 | 66 | 1.3 |
| Non-Indigenous | 89 | 0.3 | 96 | 0.2 | 87 | 0.4 | 81 | 0.4 | 75 | 0.5 |
| Geographic location | ||||||||||
| Metropolitan | 90 | 0.4 | 96 | 0.2 | 87 | 0.4 | 82 | 0.4 | 77 | 0.5 |
| Provincial | 86 | 0.7 | 94 | 0.6 | 85 | 0.7 | 77 | 0.8 | 67 | 1.2 |
| Remote | 87 | 1.6 | 94 | 1.3 | 83 | 2.4 | 77 | 2.0 | 66 | 4.8 |
| Socioeconomic background | ||||||||||
| Lowest quartile | 86 | 07 | 93 | 0.6 | 86 | 0.7 | 76 | 0.9 | 68 | 1.0 |
| Second quartile | 89 | 0.6 | 95 | 0.5 | 87 | 0.7 | 80 | 0.8 | 72 | 1.0 |
| Third quartile | 90 | 0.6 | 97 | 0.4 | 87 | 0.8 | 82 | 0.8 | 76 | 1.0 |
| Highest quartile | 92 | 0.6 | 98 | 0.4 | 87 | 0.7 | 86 | 0.7 | 82 | 0.7 |
| Immigrant background | ||||||||||
| Australian-born | 88 | 0.4 | 95 | 0.3 | 86 | 0.5 | 80 | 0.5 | 71 | 0.6 |
| First-generation | 91 | 0.6 | 96 | 0.3 | 88 | 0.6 | 82 | 0.7 | 77 | 0.8 |
| Foreign-born | 92 | 0.7 | 97 | 0.5 | 88 | 0.8 | 82 | 1.3 | 83 | 1.1 |
| OECD average-35 | 83 | 0.1 | 93 | 0.1 | 65 | 0.1 | 71 | 0.1 | 59 | 0.1 |
Can students identify motivated behaviour?
Measuring motivation also involves determining whether or not students can correctly assess what motivation looks like in day-to-day life and recognise motivation in others. This is important because studies suggest that students cannot display motivated behaviours if they do not know what they look like.
The report highlighted significant differences in the ability of various student groups to correctly identify motivated behaviours when presented with three scenarios illustrating low, moderate and high motivation. Several groups were far more likely to incorrectly identify negative (or low) motivation behaviours – for example, ‘Julian’s’ tendencies to give up easily when confronted with a problem and to be often unprepared – as positive. Fourteen per cent of Indigenous students (compared with 5 per cent of non-Indigenous peers), 13 per cent of remote area students (compared with 5 per cent of metropolitan students) and 9 per cent of students in the lowest SES quartile (compared to 3 per cent in the highest quartile) agreed that ‘Julian’ was motivated.
Table A.5 Student's motivation evaluation (calibration) for Australia and selected countries?
| Country | Percentage of students who agreed that: | |||||
|---|---|---|---|---|---|---|
| Julian is motivated? Gives up easily when confronted with a problem and is often not prepared | Marina is motivated? Mostly remains interested in the tasks she starts and sometimes does more than expected | Adrian is motivated? Wants to get top grades at school and continues working on tasks until perfect | ||||
| % | SE | % | SE | % | SE | |
| Finland | 4 | 0.3 | 93 | 0.4 | 93 | 0.4 |
| Japan | 3 | 0.2 | 95 | 0.3 | 97 | 0.3 |
| Macao (China) | 6 | 0.3 | 94 | 0.4 | 93 | 0.4 |
| Estonia | 7 | 0.4 | 92 | 0.4 | 95 | 0.4 |
| Hong Kong (China) | 6 | 0.4 | 95 | 0.4 | 94 | 0.4 |
| New Zealand | 7 | 0.4 | 88 | 0.5 | 96 | 0.3 |
| Ireland | 4 | 0.4 | 94 | 0.4 | 97 | 0.3 |
| Canada | 5 | 0.3 | 88 | 0.3 | 96 | 0.2 |
| Singapore | 4 | 0.3 | 94 | 0.4 | 96 | 0.2 |
| United Kingdom | 5 | 0.3 | 90 | 0.4 | 97 | 0.3 |
| United States | 5 | 0.4 | 91 | 0.4 | 97 | 0.3 |
| Australia | 6 | 0.2 | 89 | 0.3 | 96 | 0.2 |
| OECD average - 35 | 7 | 0.1 | 90 | 0.1 | 93 | 0.1 |
Does high motivation equal high achievement?
The report says high performance in PISA does not necessarily correspond to high achievement motivation, as some countries towards the top of the motivation index were some of the lowest performers academically, and vice versa. Eleven countries, including both high-performing and culturally similar English-speaking countries were selected for comparison with Australia. Those were: Canada, Estonia, Finland, Hong Kong (China), Japan, Macao (China), and Singapore (all high-performing countries); and New Zealand, the United Kingdom, Ireland and the United States (culturally similar English-speaking OECD countries). Finland, Japan, Macao (China) and Estonia all had mean scores on the achievement motivation index that were significantly lower than the OECD average, while the culturally similar countries all came in higher than the OECD average, and Hong Kong and Singapore’s scores were significantly higher than the OECD average. Australian and Canadian students’ motivation levels were roughly equal.
Nonetheless, research has found that achievement motivation is important in influencing future-oriented expectations and intentions, and in promoting the kind of mindset that helps students identify long-term career goals that protect against school failure.
Can a student be too motivated to achieve?
The survey included items that focus on students drawing comparisons between themselves and their peers and competing against their peers.
Being driven by too high a level of motivation to achieve (in these terms of comparison and competition) can work against students and turn into a disabling form of perfectionism, especially among students who set (overly) ambitious goals and expectations. Students who are overly focused on their achievement, particularly in relation to others, can develop a fear of failure, resulting in procrastination, self-doubt, and mental exhaustion. A forthcoming report will examine some negative consequences of emphasising students’ performance in relation to their peers, and explore students’ reports of test anxiety.
Read the full report, PISA Australia in Focus Number 3: Motivation, published by ACER, at https://research.acer.edu.au/ozpisa/32/