
PISA 2015: Australian students’ achievement
Research 6 Dec 2016 8 minute readResults from an international assessment of 15-year-olds reveal that the science, reading and mathematics achievement of Australian students is in decline.
PISA 2015: Australian students’ achievement
The Australian Council for Educational Research (ACER) released the first of two national reports of the 2015 Programme for International Student Assessment (PISA), titled PISA 2015: A first look at Australia’s results, in December 2016.
Managed by ACER at the national level for the Organisation for Economic Cooperation and Development (OECD), PISA measures how well 15-year-olds from across the globe are able to use their knowledge and skills in science, reading and mathematics to meet real-life challenges.
A combined total of more than half a million students from 72 countries and economies took part in PISA 2015, including a nationally representative sample of around 14 500 Australian students from 758 schools.
International comparisons
Comparing PISA 2015 results internationally, Australia performed equal 10th in science, equal 12th in reading and equal 20th in mathematics, after accounting for insignificant differences between countries and economies.
Figure 1: Performance of countries/economies in PISA 2015 in relation to Australia
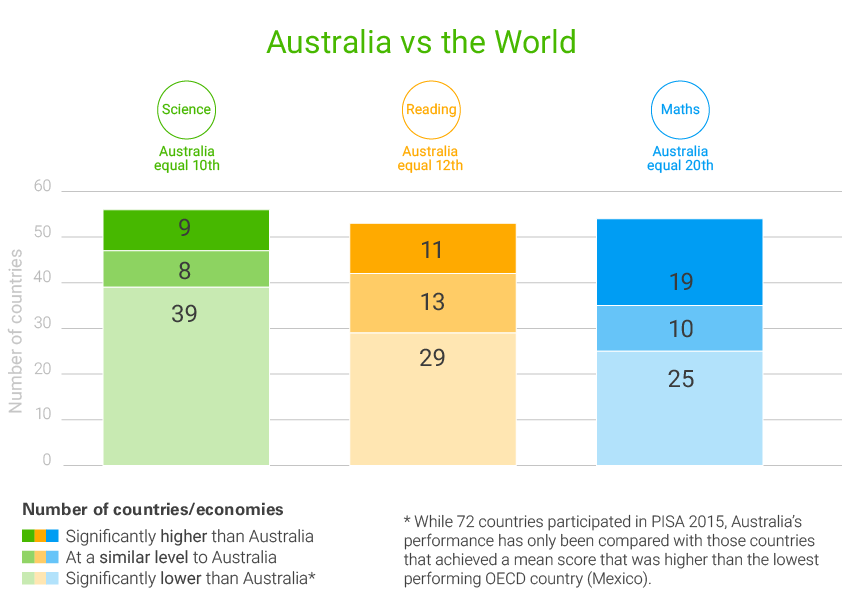
Singapore was the highest performing country in scientific, reading and mathematical literacy. Singapore’s students are ahead of Australia’s in scientific literacy by the equivalent of around one-and-a-half years of schooling, and are around one year of schooling ahead in reading literacy and two-and-a-third years of schooling ahead in mathematical literacy.
Other top-performing OECD countries were Canada, Estonia, Finland and Japan as well as partner countries or economies in the PISA program, Chinese Taipei, Hong Kong (China), Macao (China), Singapore and Korea.
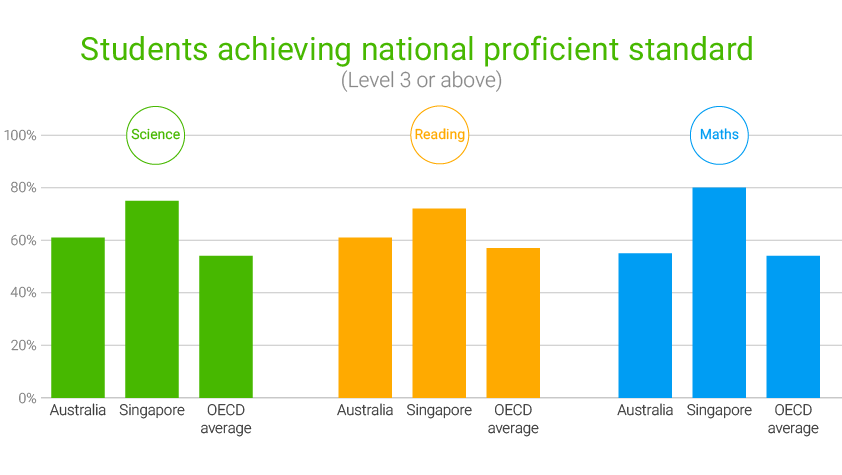
Australia’s participation in PISA is part of the National Assessment Program. As such, the Measurement Framework for Schooling in Australia identifies a proficiency at Level 3 in PISA as the agreed national proficient standard, as it ‘represents a “challenging but reasonable” expectation of student achievement’ at that age.
While the proportion of Australian students meeting or exceeding the national proficient standard, that is, Level 3 in PISA, was above that of the OECD on average, it was well below that of the top-performing country, Singapore.
Figure 2: Percentage of students achieving the national proficient standard
Australia was one of 20 countries in which there was a difference in scientific literacy achievement in favour of boys, while girls outperformed boys in 16 countries. The difference between Australian boys’ and girls’ achievement in scientific literacy was, however, small.
In all participating countries, girls performed significantly higher than boys in reading literacy. In Australia this difference was equivalent to girls receiving around one additional year of schooling.
In mathematical literacy, Australia was one of 30 countries in which the achievement of boys and girls was not significantly different, while boys outperformed girls in 20 countries and girls outperformed boys in just four countries.
Trends in achievement
Australia has participated in all six cycles of PISA since its inception in 2000, allowing trends over time to be mapped.
According to Dr Sue Thomson, ACER Director of Educational Monitoring and Research and lead author of the PISA 2015: A first look at Australia’s results report, Australian students’ ability to apply their knowledge and skills in science, reading and mathematics to real life situations is not only slipping backwards relative to other countries, but declining in an absolute sense.
Figure 3: Australian achievement in PISA since 2000
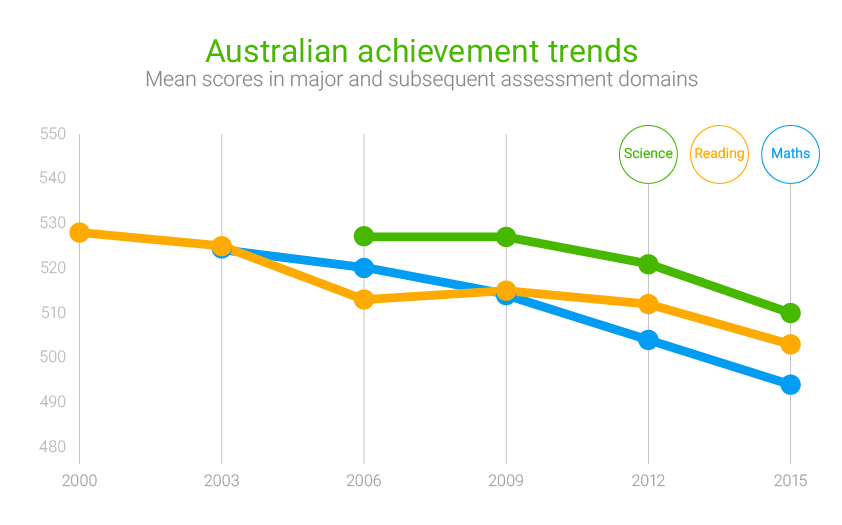
PISA 2015 shows that Australia’s performance in scientific literacy – the major domain assessed in 2006, and again in 2015 – declined by the equivalent of around half a year of schooling. Twelve other countries have also seen a significant decline in scientific literacy performance between PISA 2006 and PISA 2015, while six countries and economies have experienced improvements in scientific literacy over the same period.
In reading literacy, Australia was one of nine countries to show a significant decline in performance between 2009 – the last time reading literacy was the major domain – and 2015. For Australia this decline was equivalent to almost half a year of schooling. Fourteen countries improved their performance in reading literacy between 2009 and 2015.
Australia’s performance in mathematical literacy declined by the equivalent of around one third of a year of schooling since 2012 – the last time mathematical literacy was the major domain. Nine other countries have also seen a decline in mathematical literacy performance between PISA 2012 and PISA 2015, while eight countries improved their performance in mathematical literacy over the same period.
Results within Australia
Location
Comparing the performance of Australia’s states and territories, while Victoria and the Northern Territory saw no significant change in achievement in scientific literacy, all other states and the Australian Capital Territory experienced a decline between 2006 and 2015.
In reading literacy there was no decline between 2009 and 2015 for any state or territory except Queensland.
In mathematical literacy, the ACT, Victoria, South Australia and Tasmania experienced no significant change between 2012 and 2015; Western Australia, New South Wales and Queensland experienced a decline, while the NT significantly improved the equivalent of more than three-quarters of a year of schooling.
Location within the states and territories also affected performance in PISA 2015 as, on average, students attending metropolitan schools outperformed students in provincial schools, who in turn outperformed students in remote schools.
Student scientific literacy performance has declined significantly in metropolitan schools and provincial schools since PISA 2006, by the equivalent of around half a year of schooling for students in metropolitan schools and the equivalent of around one year of schooling for students in provincial schools. There were also significant declines in mathematical literacy performance for students in metropolitan schools to the equivalent of around one-third of a year of schooling. There has been no significant decline in reading literacy since PISA 2009 for students in metropolitan, provincial or remote schools.
Student background
The report compares the achievement of Australian students in terms of their background characteristics, such as country of birth, main language spoken at home, Indigenous status and socioeconomic background.
Australian-born students performed significantly lower than first-generation students and at a statistically similar level to foreign-born students.
Table 1: Percentage of students meeting or exceeding the national proficient standard
| Scientific literacy | Reading literacy | Mathematical literacy | |
| Australian-born | 61 | 60 | 55 |
| First generation | 64 | 66 | 60 |
| Foreign-born | 58 | 59 | 56 |
In terms of language background, students who mostly spoke English at home performed significantly higher on average in scientific literacy, mathematical literacy and reading literacy than students who mostly spoke a language other than English at home, however the proportions of high performers in each group was similar.
Indigenous students achieved significantly lower scores than non-Indigenous students in scientific literacy, mathematical literacy and reading literacy. Across all three domains, Indigenous students are under-represented at the higher end of the proficiency scale and an over-represented at the lower end of the proficiency scale.
In all three domains of PISA 2015, students in the highest socioeconomic (SES) quartile outperformed students in the lowest SES quartile by a difference equivalent to around three years of schooling.
School sector
The report also compares the performance of the three Australian school sectors: government schools, Catholic schools and independent schools. On average, students in the independent school sector performed higher than students in the Catholic school sector, who in turn outperformed students in the government school sector.
However, because there are higher proportions of students from lower socioeconomic backgrounds who attend government schools compared to the proportions of students from lower socioeconomic backgrounds who attend Catholic or independent schools, to ensure fair comparisons school sector results are adjusted for differences in an individual student’s family background or socioeconomic background as well as the school-level socioeconomic background.
When student-level socioeconomic background is taken into account, the differences between the school sectors are reduced.
When school-level socioeconomic background is also taken into account, there is no significant difference between students in government schools and students in Catholic schools, nor between students in government schools and students in independent schools. However, the differences between students in Catholic schools and students in independent schools remain.
This result was not seen in PISA 2009 and 2012, when no significant differences in performance between school sectors were found once student-level socioeconomic background and school-level socioeconomic background were taken into account.
Read the full report:
PISA 2015: A first look at Australia’s results, by Sue Thomson, Lisa De Bortoli, Catherine Underwood, ACER (2016).
A more detailed report on Australia’s results from the 2015 Programme for International Student Assessment will be available in February 2017.