
The PAT Data Explorer – an exciting new way to report
ACER news 15 Jun 2021 9 minute readThe ACER School Assessments team recently introduced schools to the new capabilities offered by adaptive testing in two free webinars, ahead of the official release of PAT Adaptive assessments in Term 3 2021.
The second session focused on an exciting new reporting interface, the PAT Data Explorer, available with PAT Adaptive assessments*. ACER School Assessment Services Manager Dr Jarrod Hingston and OARS Helpdesk Team Leader Toby Newton led the discussion.
Dr Hingston explained the background to the PAT Data Explorer’s genesis.
‘In adaptive testing, students follow individual test pathways that are determined by their answers,’ Dr Hingston said. ‘We asked ourselves how, if students are responding to different test items, can we effectively and meaningfully report on this? And how do we make the data more actionable and powerful?’
The answer was to develop a new reporting function that allows users to explore the data in different ways. While reporting the results of linear tests like PAT Maths 4th Edition and PAT Reading 5th Edition requires you to select your report format as a first step, adaptive test reporting through the PAT Data Explorer begins with the data.
‘We wanted to reduce the number of steps and decisions teachers have to make before getting student results,’ Mr Newton, the driving force behind its design, said. ‘With the PAT Data Explorer, we flipped reporting on its head – now you see the data first and go from there, drilling down into data by switching between report types, changing dates and applying filters.’
The result is a dynamic and intuitive interface that integrates seamlessly with data from linear assessments.
Watch ‘PAT Adaptive – Using the Data Explorer’ below or read on for more highlights.
Achievement scales at the centre
But the move to adaptive has seen the team retain highly valued features from linear PAT tests, such as the ability to view test items and metadata and, perhaps most importantly, the achievement scales that form the centrepiece of all PAT assessments.
‘ACER’s Progressive Achievement approach is a really powerful way to monitor student progress and it underpins all our student assessments, including the adaptive iterations,’ Dr Hingston said. ‘Achievement bands are abstract without interpretation and a key feature of PAT is its described achievement scale, which details the skills, knowledge and understandings typical at an individual level of achievement in a learning domain.
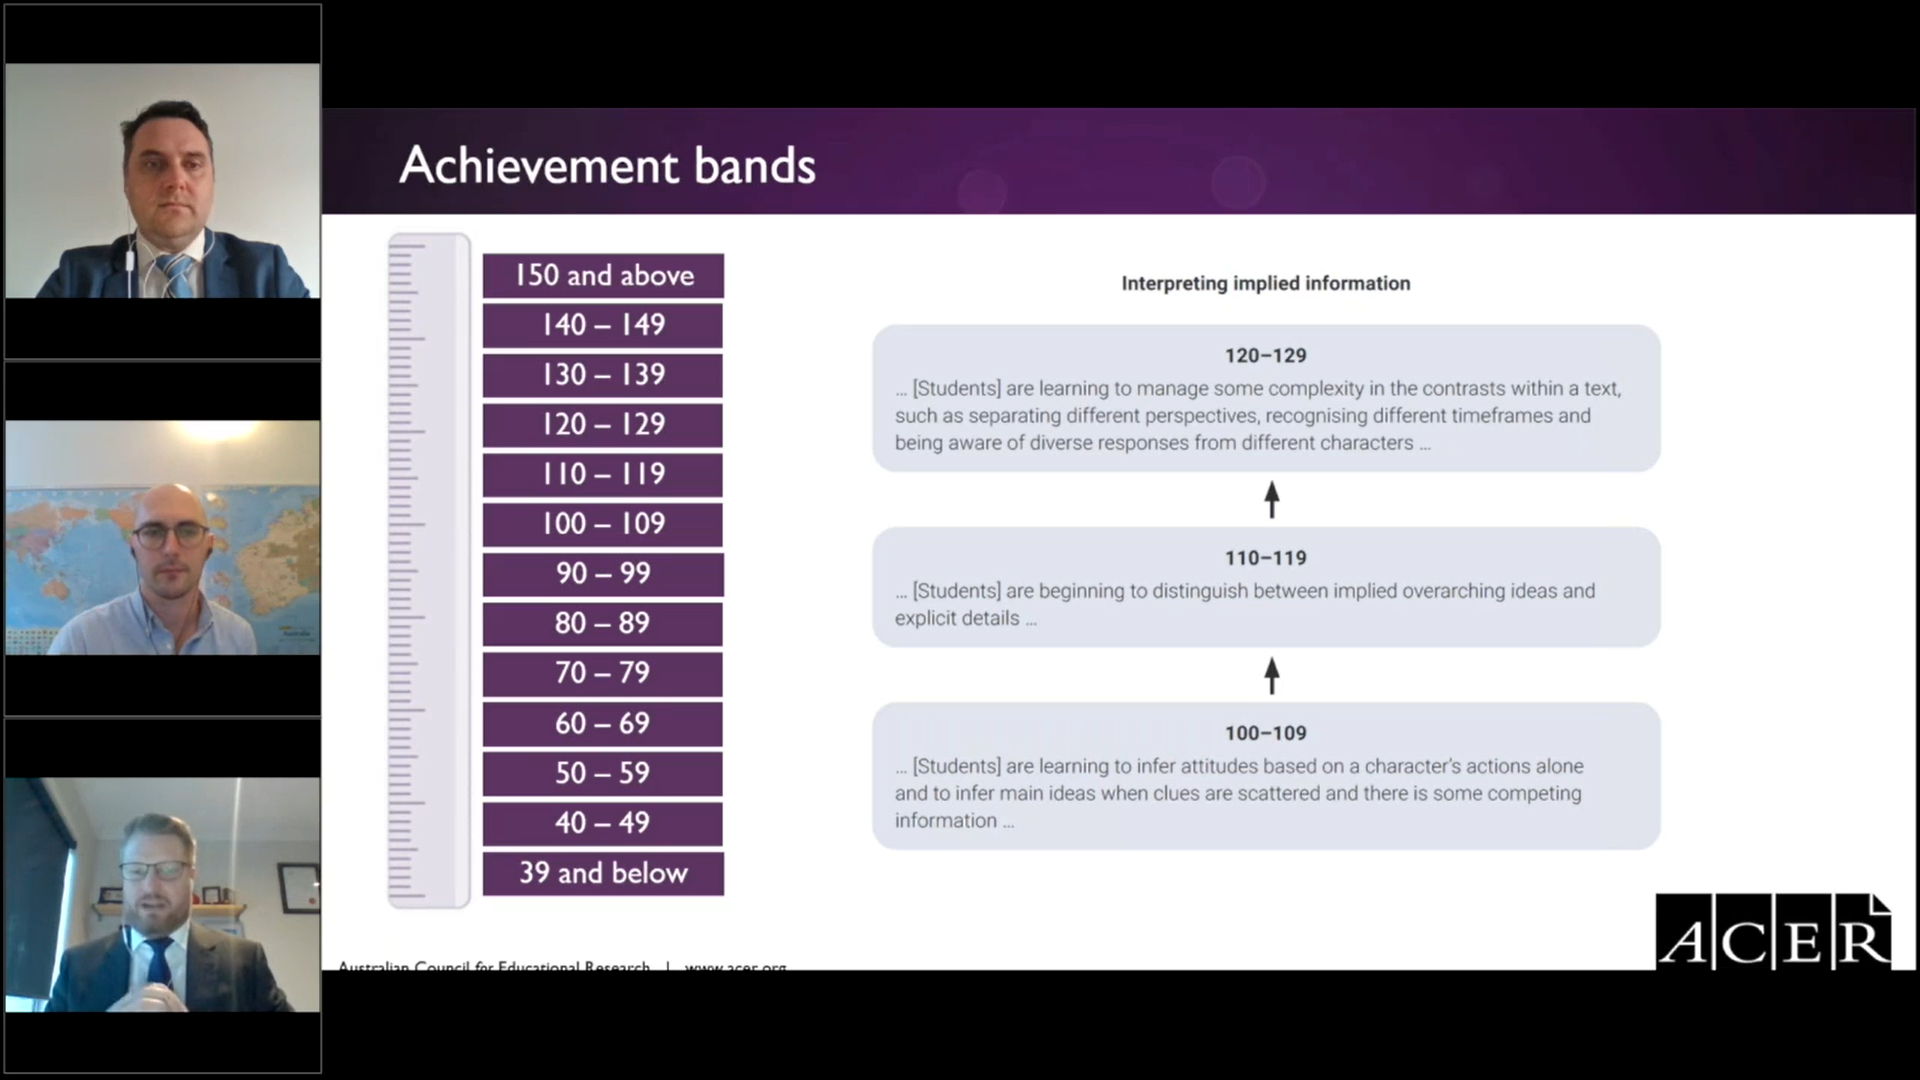
Pictured (top to bottom): Daniel O'Loughlin, Toby Newton and Jarrod Hingston discuss PAT achievement bands in a 'PAT Adaptive – Using the Data Explorer' webinar
‘Because the scales are consistent between linear and adaptive, we have been able to ensure that reliable and valid comparisons can be made between their results.’
In short, if a school already uses PAT Reading 5th Edition, they will be able to easily and quickly compare results with PAT Reading Adaptive.
Dr Hingston said the team had performed extensive testing to achieve this level of certainty.
‘We’ve invested a lot of time into trialling and validation work and we’re very confident in the equating between traditional and adaptive scales in both maths and reading,’ Dr Hingston said.
Exploring the Explorer
In the webinar, Mr Newton demonstrated the ease with which the PAT Data Explorer enables users to switch between report types – from an achievement bands bar chart to a completed tests dot plot with hover function giving quick access to individual student results – with a single click. A norm referencing function offers instant comparisons with Australian averages and percentile rankings, while individual student data can be analysed in a number of formats.
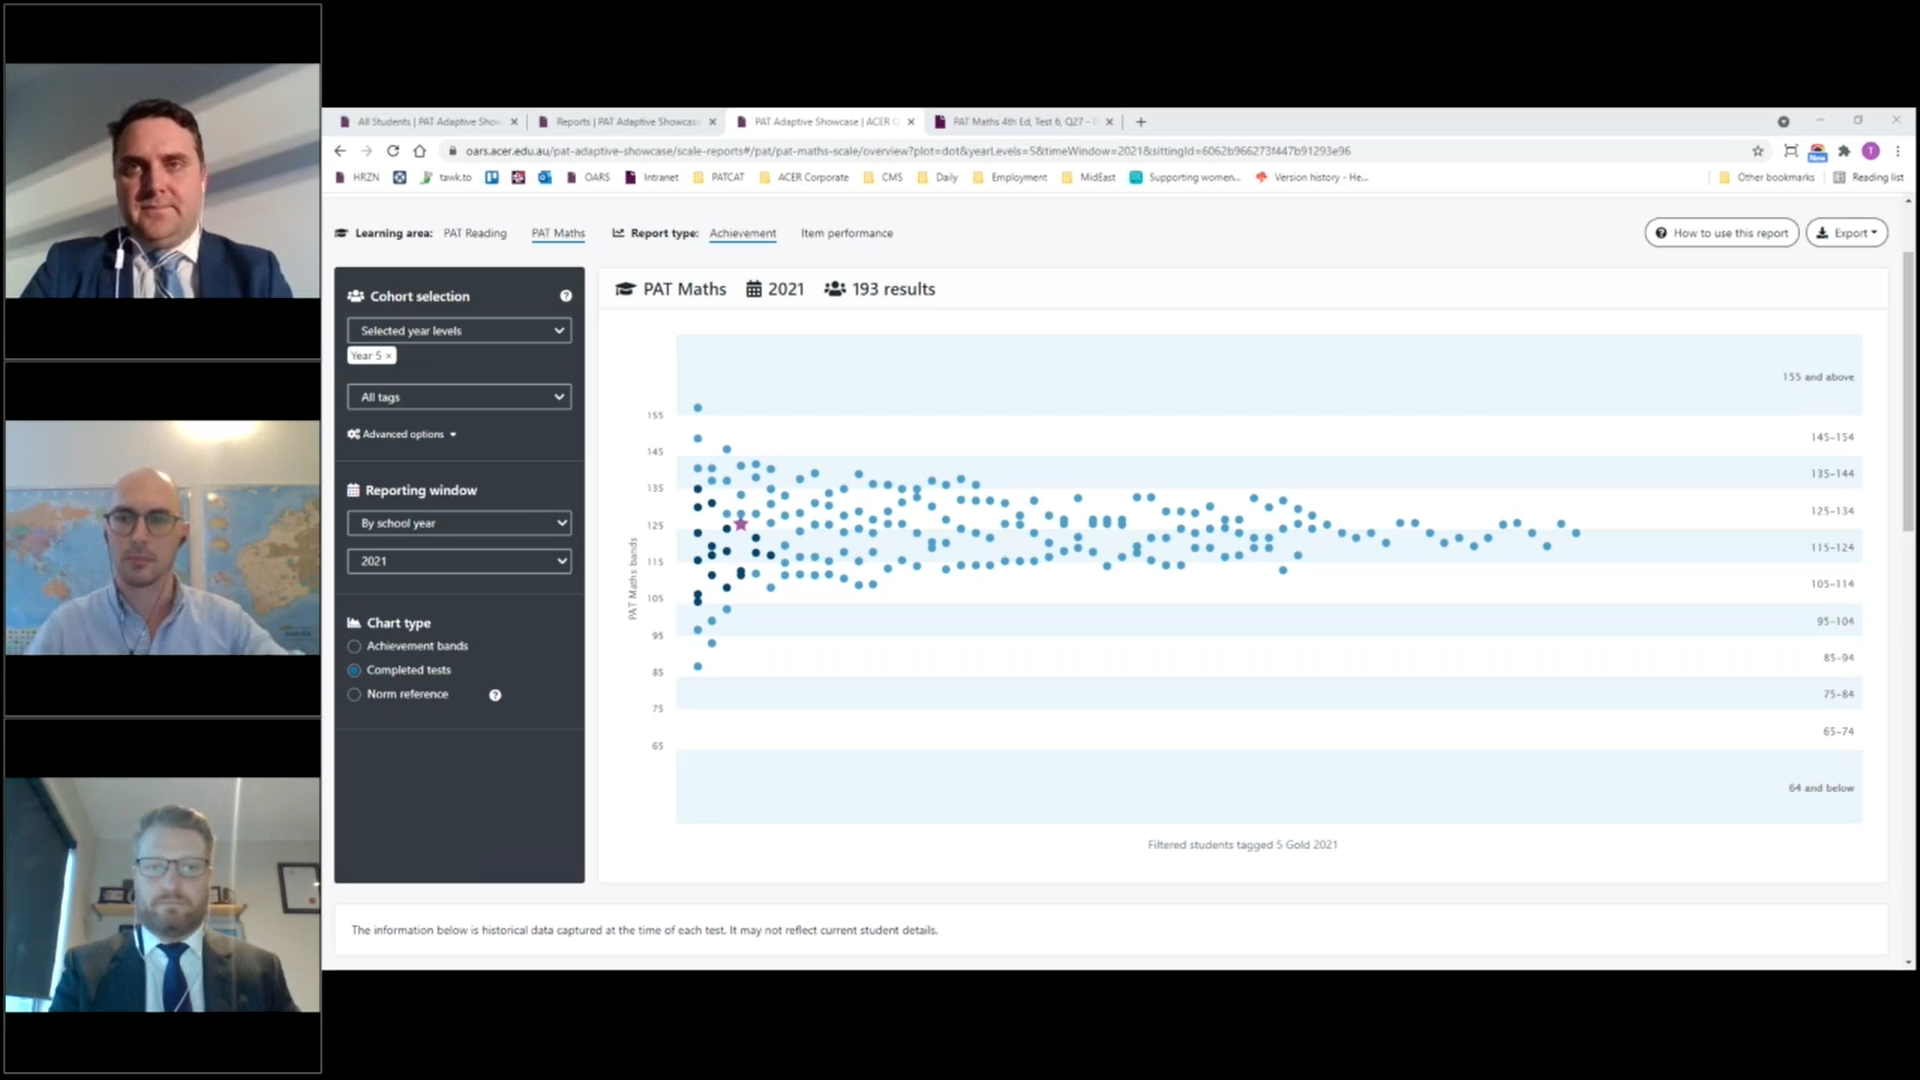
Pictured: an example of a PAT Data Explorer 'dot plot' displaying results from a PAT Maths Adaptive assessment
‘Different ways to group data allow for greater diagnostic power,’ Mr Newton said. ‘For example, you might explore a student’s achievement by grouping items by strand – a number of incorrect questions in a particular strand that are scored at a difficulty level lower than the student’s scale score may indicate an area they’re struggling with.’
Mr Newton said analysing group performance is a challenge in reporting adaptive test results, because students see different items determined by their performance. The PAT Data Explorer offers this solution: the Item Performance report, which describes the questions seen by all students in a cohort and, by sorting in a variety of ways, can give valuable insights into achievement.
'By identifying items that troubled a significant proportion of students, and by comparing the difficulty of items with the ability of students, we’re able to focus in on areas that need more attention,’ Mr Newton said. ‘Students responding incorrectly to items with a scale score lower than their ability may warrant a closer look and more support in this particularly skill.’
Catch up, free and on demand
This was the second of two sessions showcasing the capabilities of the new PAT Adaptive assessments. Watch the first webinar, ‘PAT Adaptive – An Introductory Session’, below.
New features coming soon to PAT Adaptive:
- Progress reports: a new take on the popular longitudinal report
- Greater integration with the PAT Teaching Resources Centre
Ask the experts:
Here are some of many questions asked by teachers and school leaders during our interactive webinar. Answers were supplied by Jarrod Hingston (JH) and Toby Newton (TN).
Can PAT Adaptive be administered at any point in the school year?
JH: The short answer is yes, although nationwide norm data will still be updated at the end of the year. However, by using PAT Adaptive at the start of the year, you’ll get a much finer-grained analysis of the point-in-time capabilities and needs of each student that will help guide your teaching throughout the year.
Some schools have asked us about the value of assessing students at multiple points in the academic year in order to more closely monitor their progress. In response to this feedback, we’ll be introducing parallel ‘testlets’ containing new content that can be used for this purpose.
Is there any data that can’t be compared between linear and adaptive versions of PAT?
JH: We’ve invested a lot of time in trialling and validation and we’re very confident in the equating between traditional and adaptive scales in both maths and reading, and that work continues. We haven’t yet been able to confirm what happens with aggregation of data though, and we’re working with several systems on pilot studies to get a clearer idea of this.
Our school system purchases our licence. How do we find out more about PAT Adaptive in this context?
JH: We’re briefing at a system level on our new adaptive versions but please talk to your system contact about finding out more.
How would you recommend using PAT Adaptive alongside linear PAT assessments?
JH: We’ve mapped out several scenarios that you’ll find in the Help section of your school’s online account, but it really comes back to purpose.
We haven’t created PAT Adaptive to replace linear – they’re still fantastic, reliable tests and we know some teachers will prefer students to sit the same items – but we’ve designed it to be complementary.
We imagine some schools will continue using linear tests in Term 4 to measure growth year-on-year but administer adaptive earlier in the year to get finer diagnostic information and a richer data set to inform next steps in learning.
We don’t recommend using PAT as a quarterly growth measure because that’s likely to result in statistical error.
How important is same-time testing for longitudinal growth reporting?
TN: If tracking growth over time is your goal, consistency is crucial and removes a significant source of potential statistical error. The new Progress report will, like the longitudinal report, allow you to track growth at semester and year intervals. We still recommend a 9–12-month gap between administrations. The main difference between the two is that it begins at the cohort level – helping us identify trends by aggregating data – but still allows you to drill down into individual student results, rather than starting with the student.
Can you compare percentiles (adaptive) with stanines (linear)?
TN: Yes, the scales and norm samples used by each are the same and can be compared directly. Stanines are simplified groupings of percentile rankings and can be calculated very easily.
* The PAT Data Explorer is now also available with PAT Spelling Skills, launched 7 March 2022.