What can TIMSS tell us about the average Australian classroom?
Research 29 Nov 2016 5 minute readSue Thomson explores what the results from an international assessment of mathematics and science reveal about the students in a typical Australian classroom.
Results from the 2015 Trends in International Mathematics and Science Study (TIMSS) were released today by the Australian Council for Educational Research (ACER). According to the report, TIMSS 2015: A first look at Australia’s results, Australian performances in mathematics and science have stagnated over the past 20 years.
TIMSS has measured student achievement at Year 4 and Year 8 in Australia and many other countries since 1995. Results from TIMSS 2015 reveal little change in Australian students’ achievement since 1995. Only in Year 4 mathematics is the score significantly higher than in 1995, and this is because of a small jump in scores in 2007 – since then there has been no change.
During this same period, the high-performing countries Singapore, Korea, Hong Kong, Chinese Taipei and Japan made steady improvements, while other countries including Canada, England, Ireland, Northern Ireland and the United States have improved and now outperform Australia.
TIMSS 2015 shows that Australian Year 4 students were significantly outperformed by students in 21 countries in mathematics and 17 countries in science. At Year 8, Australian students were outperformed by those in 12 countries in mathematics and 14 in science.
International studies like TIMSS paint a very broad picture of international and national achievement, but what do the TIMSS results mean for actual Australian classrooms? Translate the results into an average classroom of 25 Year 4 students and the picture for mathematics achievement looks as below.
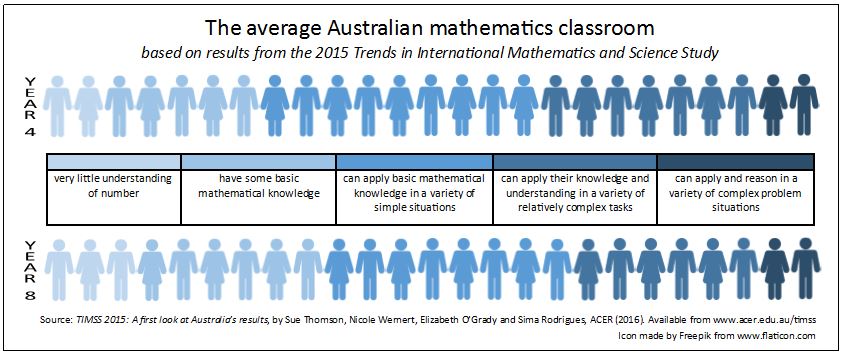
After four further years of schooling, the picture doesn’t really improve. An average classroom of 25 Year 8 students looks as above.
Three students in the Year 8 class have still gained very little idea about number and can probably only do some very basic mathematical tasks. The 16 students in the next two levels have large gaps in their mathematical knowledge, will probably be anxious about mathematics for the rest of their lives, and actively avoid situations where they might need to use it. The six students in the second highest category have a solid understanding of mathematics and will be able to use it in their everyday working lives. The remaining two students have a deep understanding of mathematics and are probably those students who will go into STEM careers.
Alarmingly, the TIMSS results also show a large tail of underperformance at each year level in both mathematics and science. Australia’s Measurement Framework for Schooling identifies a proficiency at the Intermediate international benchmark in TIMSS as the nationally agreed proficient standard for Australia. The 2015 TIMSS results show that around one-third of Year 4 students and around one-third of Year 8 students fail to achieve the nationally agreed proficient standard (the lower two groups in the average Australian classroom depicted above).
The differences in levels of achievement are starkest in terms of socioeconomic background. TIMSS investigated student achievement for both Years 4 and 8 by socioeconomic background as indicated by the reported number of books in the home and, for Year 8 students, by the level of parents’ education.
The average mathematics score for a Year 4 student who reported having many books in the home was 548 points, a score that would earn them a place in the international top eight countries. For the quarter of all Year 4 students who reported having only a few books in the home, their average score of 474 points would put them clearly in the lower half of all country rankings.
More startling is the difference in the proportion achieving the proficient standard – 72 per cent of students with many books in the home compared to 51 per cent with few books in the home. The story is similar for Year 8 in mathematics and even worse in science.
The gaps in achievement between Australia’s Indigenous and non-Indigenous students remain as they were 20 years ago. Indigenous students score between 60 and 70 points lower than non-Indigenous students in both mathematics and science at both year levels in TIMSS, with between one-half and three-quarters of students not achieving the national proficient standard, compared to between one-quarter and one-third of non-Indigenous students.
In global terms, Australian educational levels are still what they were late in the last century. At the same time other countries have changed their trajectories and slowly but steadily improved their educational system. Taking a closer look at a high-performing country, an average Year 8 mathematics classroom in Singapore looks as below.
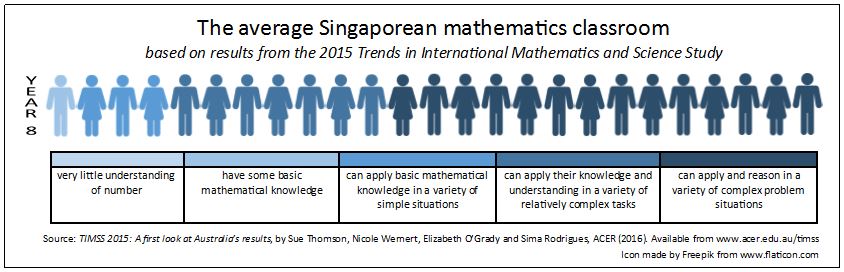
In an average Year 8 Singapore mathematics classroom, no students are under the low benchmark, and only one student would not have achieved the Australian proficient standard. However, more than half of the class would have achieved the highest level – showing deep understanding of the material they were presented with. In Year 8 science, 43 per cent of Year 8 students in Singapore were similarly in the top category of achievement.
If Australia is to improve its educational performance in order to compete with countries such as Singapore it needs to focus on long-term, coordinated and interconnected strategies that address the issues facing schools – among them disparities between schools and making teaching more attractive to highly able school leavers.
Read the full report:
TIMSS 2015: A first look at Australia’s results, by Sue Thomson, Nicole Wernert, Elizabeth O’Grady and Sima Rodrigues, ACER (2016).