

Wednesday, 28 Jul 2021
In this story, our expert school support team use the new PAT Data Explorer to answer some questions commonly asked by schools.
PAT Reading Adaptive and PAT Maths Adaptive share the same assessment frameworks and achievement scales as their conventional counterparts, PAT Reading 5th Edition and PAT Maths 4th Edition. This means that there is no disruption to how you should approach or understand the results of your students. But, in combination with the new PAT Data Explorer, PAT Adaptive assessments provide new ways to collect and analyse rich diagnostic information about the achievement of every student.
To help you make the most of PAT Adaptive and the PAT Data Explorer, we have collected and answered some questions you might be asking of your PAT data and illustrated them using screen previews from within an online school's account.
Questions:
How large is the spread of achievement in my group of students?
Who are my highest and lowest achieving students?
Are there differences in achievement between groups at the same year level?
Answers:
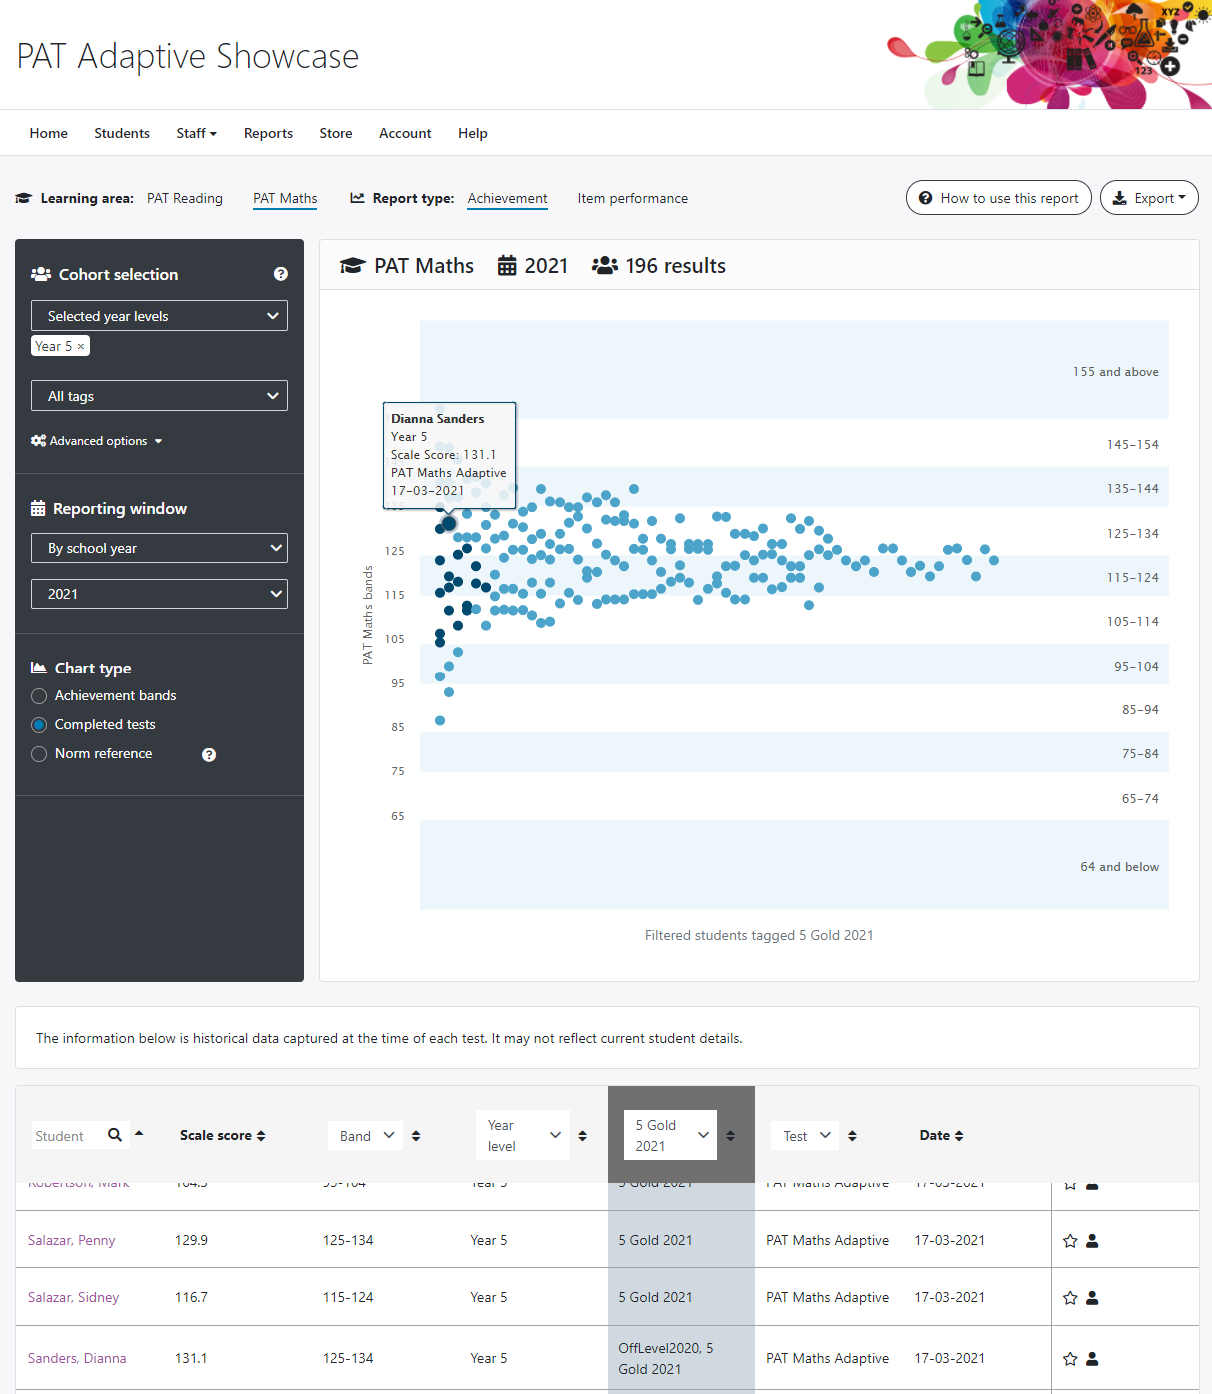
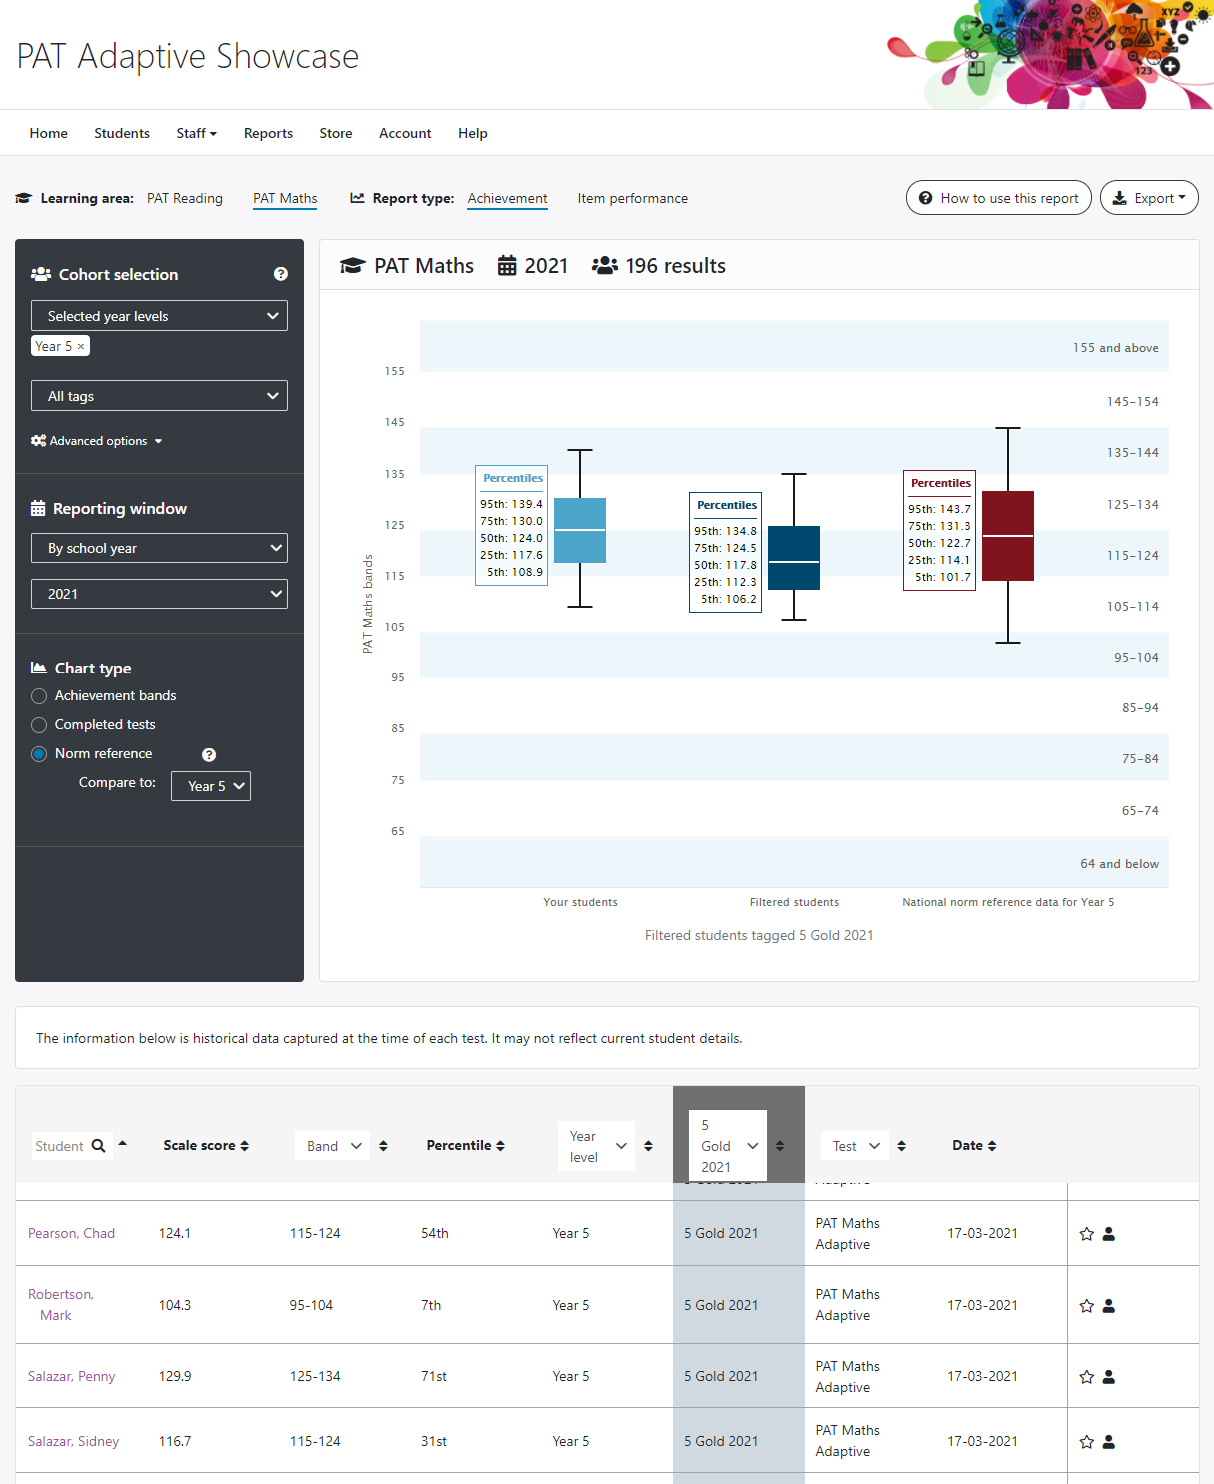
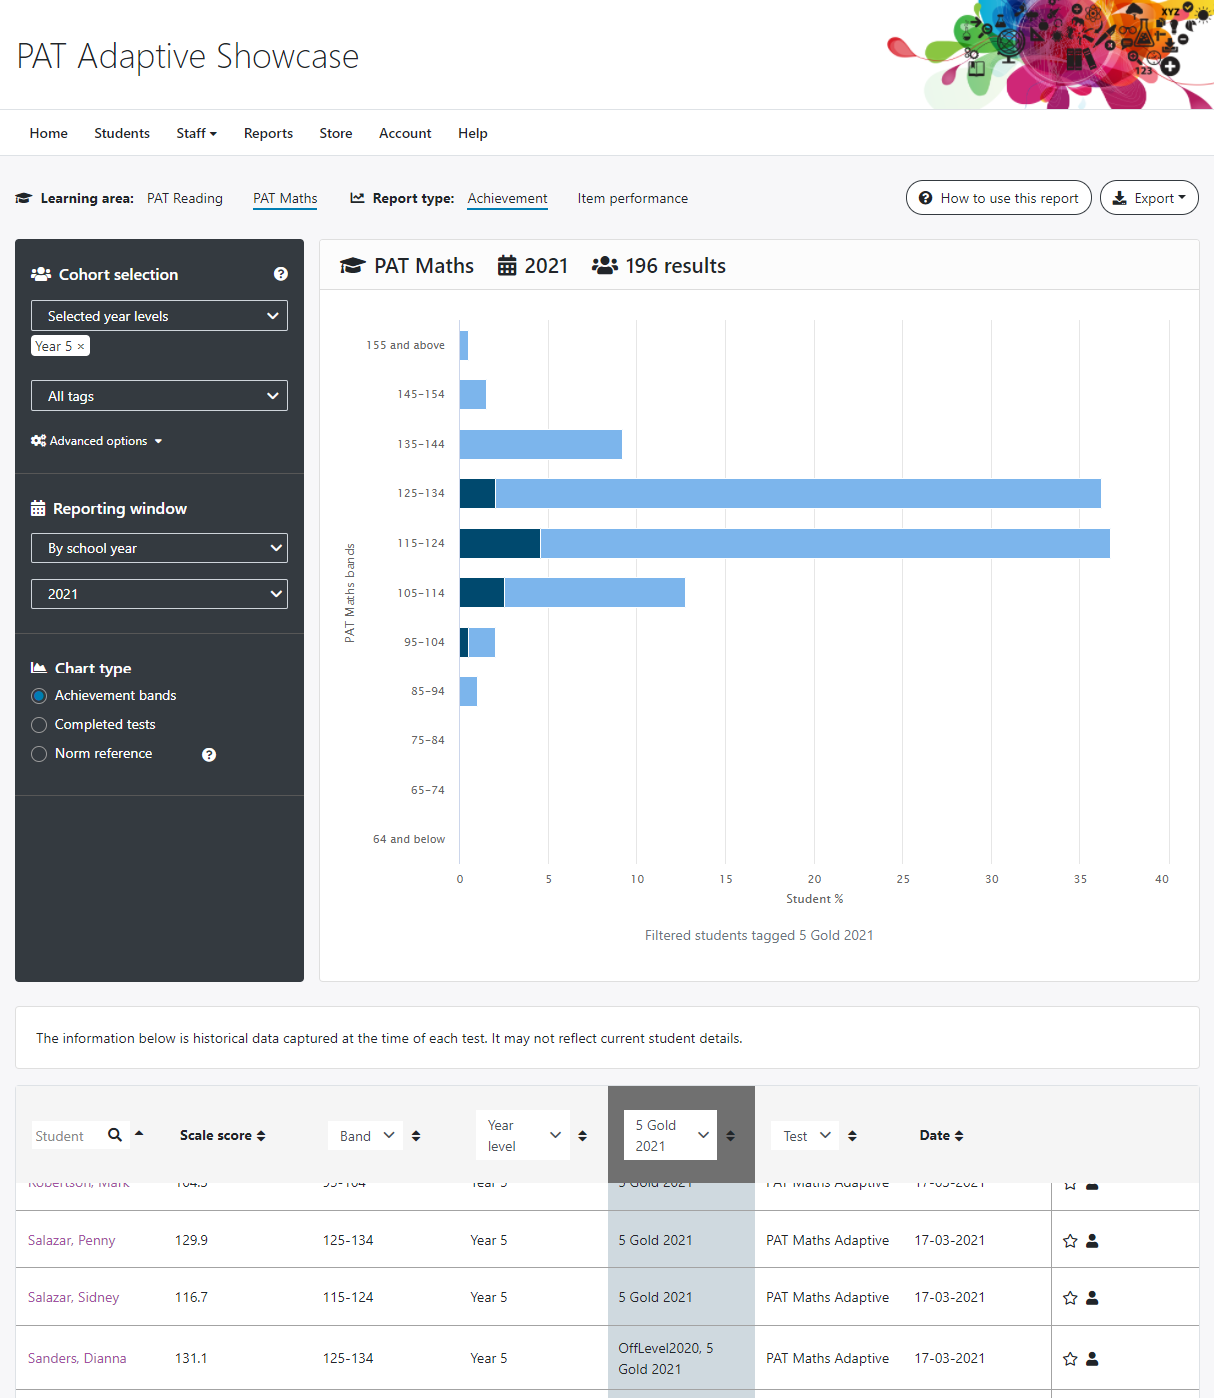
The Achievement report appears first when you open the PAT Data Explorer and provides an overview of the scale score achievement of your students. Initially displaying student results grouped by achievement band, this report can also show the individual results of students plotted as dots against the PAT scale, or as a box plot alongside the Australian norm achievement (both pictured below). Each of these charts provide a different way to explore and understand the overall achievement of a group of students in the learning area. At a glance, you can see how your students have achieved as a group and against the Australian norms, identify your highest and lowest achieving students, and understand where the majority of students are in their learning.
Within your selected cohort, you can also identify the achievement of smaller groups of students by using student tags to filter the table of results. For example, as a classroom teacher, you may be interested in understanding the achievement of your class compared to the wider year level cohort.
Student results plotted against the PAT scale generated by the PAT Data Explorer:
A 'box plot' comparing results with Australian norms:
Questions:
Which students are working at a similar level?
What skills have they demonstrated and how can I effectively target their needs?
Answers:
For both PAT Maths and PAT Reading, the achievement bands are the quickest way to find out which students have achieved at a similar level and to understand the skills and knowledge they are likely to have or be working towards. To find this information within the PAT Data Explorer, simply click one of the achievement bands within the Achievement report to load a Band report (pictured below). The students reported here have achieved at a similar level, information which may help you effectively target their needs as a group. In addition to the students’ results, this report also includes descriptions of the skills typical of students at this band, allowing you to translate the abstract PAT scale scores into a meaningful picture of students’ abilities and knowledge. Navigate up and down through the achievement bands to view students and descriptions at each level.
An achievement band report:
Questions:
Which kinds of items and skills did my students find most difficult?
Are there differences between different groups?
Answers:
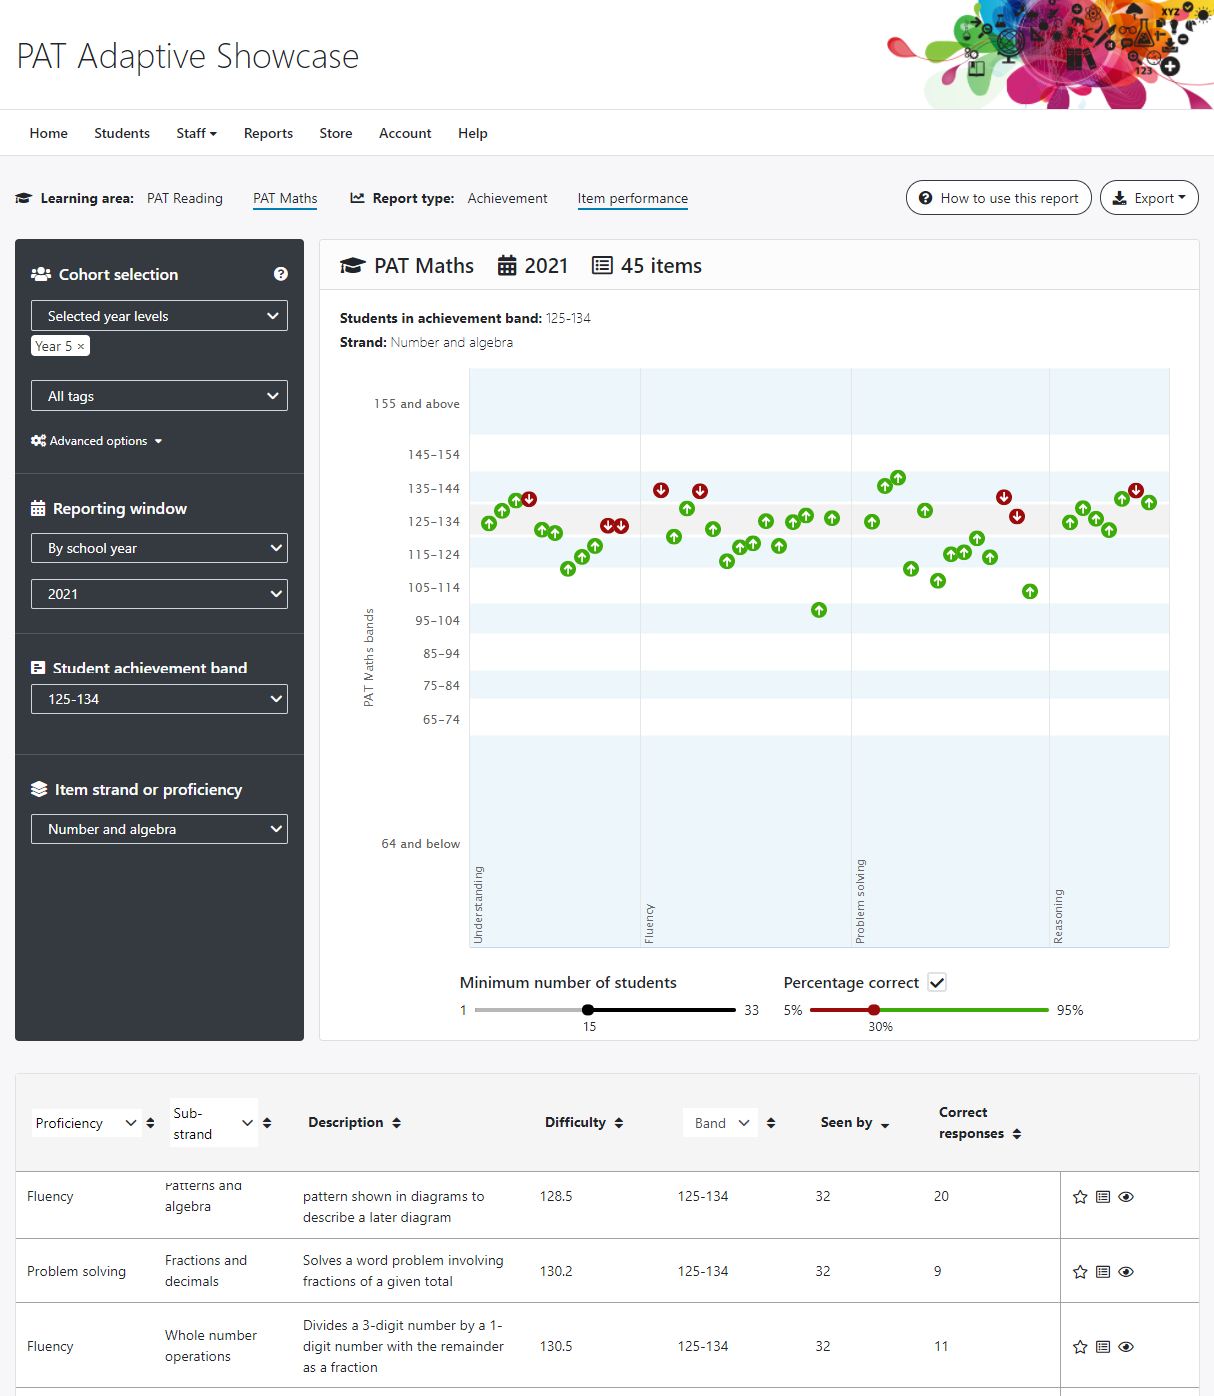
The nature of the PAT Adaptive assessments means that students are not tested on the same content. For this reason, it is not possible to represent students' PAT Adaptive item performance in a simple table like that found within the traditional Group report. Instead, the PAT Data Explorer's Item performance report (pictured) allows you to examine the items seen by your students during their tests. By using the ‘minimum number of students’ and ‘percentage correct’ sliders beneath the chart, you can immediately begin to identify items and types of items that students across a group tended to find difficult. To further help with diagnostic analysis, you can also filter results according to students’ achievement bands. This may let you identify, for example, that Statistics items in PAT Maths troubled your students at the lower bands, but higher achieving students tended to find Algebra items more difficult.
An item view:
Question:
When students responded incorrectly, what can their responses tell me about their understanding or their learning needs?
Answer:
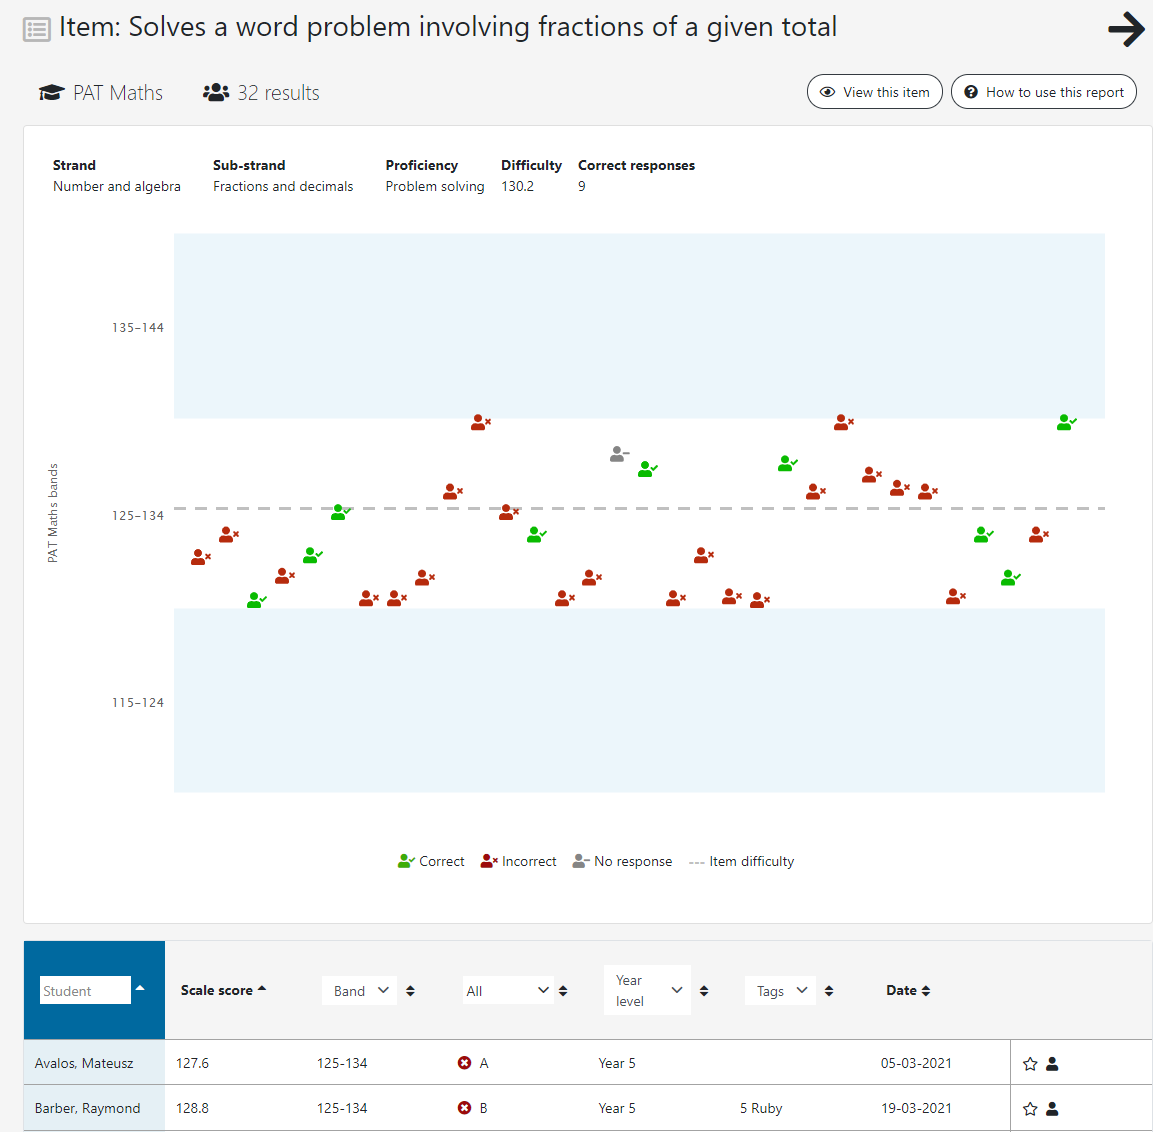
The Item performance report can help in targeting your focus on the areas of need within a group. By looking even closer at the individual items, you may also be able to derive an understanding of why students found some more difficult than others. Click on any item in the Item performance report (pictured) to examine the details of that item, including which students responded to it and how. Referencing the difficulty of the item and the scale score achievement of students, you may be able to identify unexpected responses – perhaps a simple item missed by a very able student, or possible lucky guess by a less able student. Patterns of selected responses amongst student might provide an indication of a common misunderstanding that can be addressed in the classroom. Many PAT Reading and PAT Maths items are annotated within the PAT Teaching Resources Centre and direct links to these pages from the Item report can provide more information about common errors and misconceptions (Maths) or text complexity summaries (Reading) that can help guide next steps.
An item performance report:
Find out more:
PAT Adaptive is available now. Try it free for 30 days! Read more.