
Measuring learning growth in a world of universal education
Research 2 Dec 2014 7 minute readACER is leading the development of new ‘learning metrics’ – tools for measuring learning growth – as Ross Turner explains.
Measuring learning growth in a world of universal education
Staff at the Australian Council for Educational Research (ACER) Centre for Global Education Monitoring (GEM), in 2013 identified the need to build measurement tools to monitor learning growth that could be used across different year levels and in different national contexts.
One of those projects, under ACER’s Monitoring Trends in Educational Growth program, involved the development of an assessment program in Afghanistan at the Grade 6 level, which is now being extended to Grade 3 and later possibly to Grade 9.
At the same time, the Learning Metrics Task Force led by the UNESCO Institute for Statistics (UIS) and the Center for Universal Education at Brookings was progressing rapidly in its work to develop a framework that identifies education’s central place in post-2015 global development goals as well as the tools that would be needed to monitor progress against those goals, particularly in developing countries.
With those post-2015 development goals soon to be adopted by the United Nations General Assembly, it is evident that the GEM approach to measuring learning progress is a timely development.
GEM researchers presented an approach to measuring learning progress, based on similar work over many years and in many different contexts, to a meeting of literacy experts at the UIS in Montréal in March 2014. With encouragement from the UIS, GEM researchers have since then been working to develop learning metrics to quantify and describe growth in reading comprehension and in mathematical proficiency for students from early primary school level through to middle secondary school level.
Learning metrics
The process of building learning metrics begins with the analysis of a range of test items that have been used in different kinds of learning assessments designed to measure progress in a domain of interest, from a range of different countries, with the goal of encapsulating in short descriptions the essential aspects of the cognitive demand of each item.
Empirical data can then be used to identify items by increasing level of difficulty, after which descriptions of item difficulty can be used to build summary descriptions of learning achievement in the domain at different points along a line from a lower to a higher level of proficiency. These summary descriptions of growth, at defined points along the resulting measurement scale, will make up the learning metrics.
A subsequent step will be to identify benchmarks based on these learning metrics that can be used to define learning goals appropriate to students in particular countries and at different stages of education, so that learning progress can be monitored over time. These tools will be available for use in a variety of learning and assessment contexts, including for national assessment programs, regional assessment programs and assessments in a wider international context, as well as potentially being of use to international donor agencies and funding partners in monitoring the effectiveness of their aid investments.
Building the learning metrics is progressing in three phases. The first phase involves using existing data about items from a range of assessments to build draft learning metrics. This phase, supported by strategic funding from ACER and from Australia’s aid program within the Department of Foreign Affairs and Trade, is now almost complete.
The second phase will involve administering sets of items to students in order to collect empirical data that will be used to validate the resulting draft measurement scales. GEM researchers will shortly be able to identify a small set of developing countries to participate in this phase.
The third and far more open-ended phase involves using the learning metrics in a variety of contexts to measure student progress. For example, by embedding selected items in an existing national or regional assessment program, assessment outcomes could be mapped onto the common learning metric.
Monitoring learning progress in this way can provide rich information to teachers, schools and education systems about the most appropriate teaching and learning interventions for students.
The expectation is that these tools will allow education authorities in a particular country, or across a number of countries, to locate students at points along a stable measurement scale. This would make possible comparisons among groups, and tracking of learning growth of individual students or groups of students. Monitoring learning progress in this way can provide rich information to teachers, schools and education systems about the most appropriate teaching and learning interventions for students at particular points in their learning trajectories.
What does a learning metric look like?
The learning metric for mathematics below illustrates the kind of measurement tool towards which GEM researchers are working.
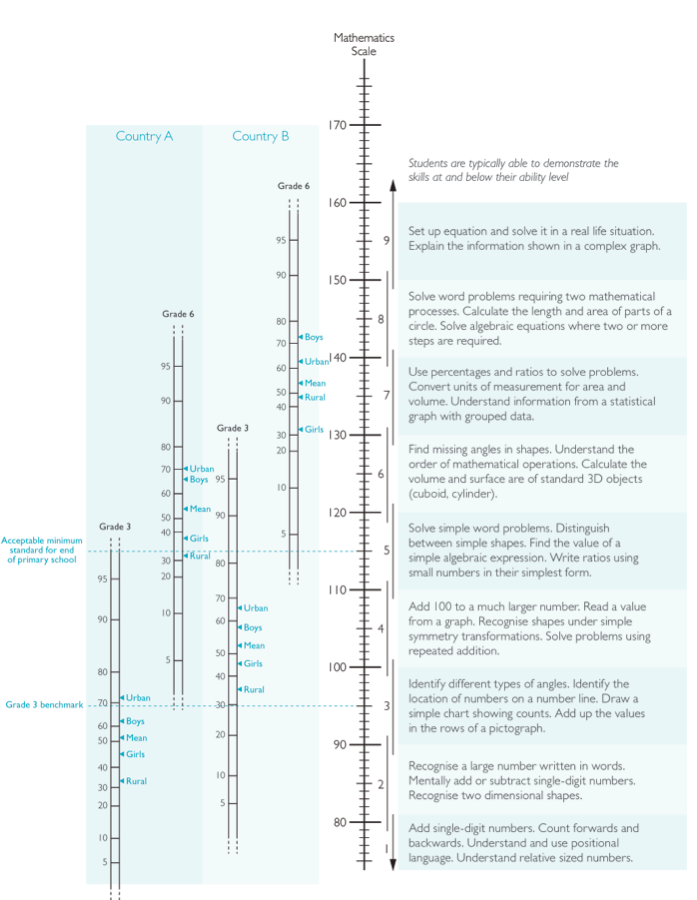
The central element is the vertically graduated ‘Mathematics Scale’, which in this case goes from about 75 at the bottom to about 175 at the top. On the right hand side of the scale, nine bands are marked and labelled, with a short description for each band, summarising the kinds of mathematical knowledge, understanding and skill observed at different parts of the scale. These elements – the scale and descriptions – are the essence of the learning metric.
A student at level 5, for example, would typically be able to ‘solve simple word problems, distinguish between simple shapes, find the value of a simple algebraic expression, write ratios using small numbers in their simplest form’, and perform tasks described in the levels below level 5.
On the left side of the scale is additional information that shows how the metric could be used. In this case, a number of comparisons are shown.
First, sets of performance distributions are shown for two countries (here labelled as Country A and Country B but in the future identifying particular countries). Within each country, a distribution is shown for students in Grade 3, and for students in Grade 6. Those distributions show percentile points for students in the grade, from the fifth percentile at the bottom, to the 95th percentile at the top.
So the Grade 3 distribution for Country A shows 50 per cent of students above 90 points on the scale and 50 per cent below; and also shows the mean for all Grade 3 boys, all Grade 3 girls, all rural students and all urban students in Grade 3. It also identifies a ‘Grade 3 benchmark’, sitting at 95 points on the scale, and shows that about 70 per cent of Grade 3 students in Country A lie below that benchmark.
The metric could be used to locate students from different grades in a particular school, from similar or different schools in a district, province or state, the performance distribution for different districts or provinces, different countries, or different groups of countries, and to monitor changes over time, all on a single comparable metric.
The aim of ACER’s GEM research to develop new learning metrics that monitor learning progress is to help educators and education policy makers to identify learning goals appropriate to particular students. They can then identify the appropriate next steps to take, and resources to provide, to support those students in their learning progress.
More information:
Read more about ACER’s GEM research at < www.acer.org/gem >